
Monitor the Apdex score for Azure Applications
Posted 11 May 2023
The Apdex score, short for Application Performance Index, is a pretty decent way to determine how your app is performing.
The score can be calculated daily, for example for SLA reports, but it becomes a lot more interesting when calculating it continuously. This will allow you to spot transient issues that would remain hidden over longer time spans.
AppInsights doesn't have this metric built-in but all the data to calculate it is available.
Measuring happiness
Apdex is a generic metric but when applied to web applications, it's used to measure how happy your users are while using your site. Happiness is a very subjective thing, so you need to be clear on what makes your users happy. Generally, the following holds true:
- Quick interactions are good
- Errors are bad
Quick is still not a quantity you can measure. A good starting point is to assume users expect a response within half a second and start getting annoyed after 2 seconds. Though UX research by Jakob Nielsen puts the threshold for satisfactory interactions at 100ms and anything more than 1 second as annoying.
This blog post by New Relic has a more in-depth explanation of how to pick your thresholds.
What numbers you pick as the threshold for tolerable and frustrating depends on the SLA you're aiming for but also where you measure the interaction. Measuring closer to the user is good as it will give better insights into the end-user experience, but will taint the measurement because it includes factors that are outside your control like slow devices and crappy network connections.
Calculating the Apdex score
To calculate the Apdex score, all interactions between people and your application are categorized as satisfying, tolerable, or frustrating. Failing requests are always frustrating.
For application performance monitoring it's usually fine to measure request duration on the edge of the backend, for example on the ingress of a Kubernetes cluster or on the Azure Application Gateway.
The final calculation looks like this: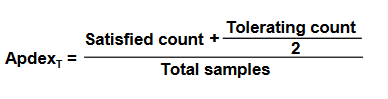

Apdex formula
The calculation results in a value between 1 and 0, where 1 is perfect and 0 is the absolute worst.
I prefer to split errors from the frustrating category to make it easier to spot why the app performance is below expectations.
Calculating the Apdex score in AppInsights
In Azure Application Insights the apdex score can be calculated from the requests table. The following query has scores for multiple services.
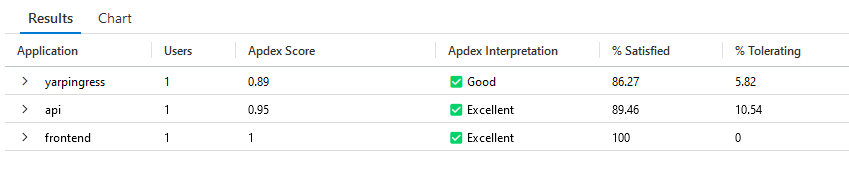
A table showing Apdex scores for services
let satisfiedThreshhold = toreal(500); // Satisfied threshold in ms
let toleratingThreshhold = 4*satisfiedThreshhold; // Tolerating threshold in ms
let apps = dynamic(['backend']); // list the apps to include here
let apdexData = requests
    // Filter out health and other skewing calls
    | where name !startswith 'GET /health' and name !startswith "GET /ready"
    // success/failure
    | extend success = column_ifexists('success', true)
    | extend Failure = iff(success == false, 1, 0)
    // Calculate the number of users, if available
    | extend User = column_ifexists('user_AuthenticatedId', 'Unknown')
    // filter for user facing services
    | extend app = iff(isempty(cloud_RoleName) == true, 'Unknown', cloud_RoleName)
    | where app in (apps)
    // analyze call duration
    | extend UserExperience = case(success != true, 'Frustrated', duration <= satisfiedThreshhold, 'Satisfied', duration <= toleratingThreshhold, 'Tolerating', 'Frustrated')
    | summarize
        Satisfied = countif(UserExperience == 'Satisfied'),
        Tolerating = countif(UserExperience == 'Tolerating'),
        Frustrated = countif(UserExperience == 'Frustrated'),
        TotalRequests = count(),
        Users = dcount(User)
        by app
    | project
        Users,
        app,
        ["% Satisfied"] = round(Satisfied * 100.0 / TotalRequests, 2),
        ["% Tolerating"] = round(Tolerating * 100.0 / TotalRequests, 2),
        ["% Frustrated"] = round(Frustrated * 100.0 / TotalRequests, 2),
        ["Apdex Score"] = round((Satisfied + (Tolerating / 2.0)) / TotalRequests, 2)
    | extend Relevance = iff(["Apdex Score"] == 0, pow(Users, 1.6), Users / ["Apdex Score"])
    | order by Relevance desc
    | project-away Relevance;
apdexData
| extend ["Apdex Interpretation"] = case(["Apdex Score"] <= 0.5, '⛔ Unacceptable', ["Apdex Score"] <= 0.7, '⚠️ Poor', ["Apdex Score"] <= 0.85, '⚠️ Fair', ["Apdex Score"] <= 0.94, '✅ Good', '✅ Excellent')
| project
    Application = app,
    Users,
    ["Apdex Score"],
    ["Apdex Interpretation"],
    ["% Satisfied"],
    ["% Tolerating"],
    ["% Frustrated"]
Continuously monitoring Apdex
Having a single number is really useful for reporting purposes but for application monitoring, it is even better to have the Apdex score plotted over time. The following query renders an area chart with a data point per interval.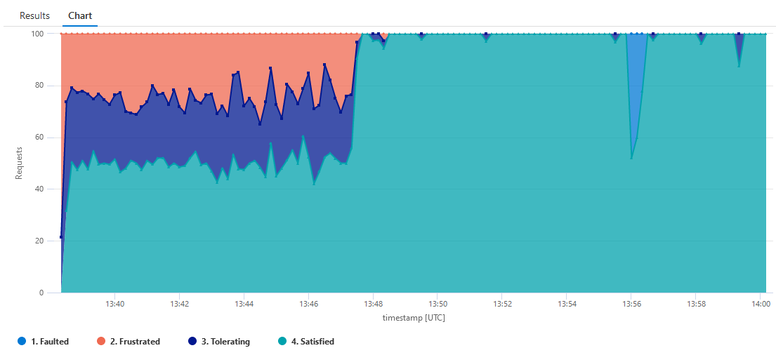

Continuous Apdex measurement in an area chart
let satisfiedThreshhold = toreal(500); // ms
let toleratingThreshhold = 4*satisfiedThreshhold; // ms
let interval = timespan(5m);
let app = 'ingress';
let appdexdata = requests
    // Filter out health and other skewing calls
    | where name !startswith 'GET /health'
        and name !startswith "GET /ready"
    // success/failure
    | extend success = column_ifexists('success', true)
    | extend Failure = iff(success == false, 1, 0)
    | extend User = column_ifexists('user_AuthenticatedId', 'Unknown')
    // filter for user-facing services
    | extend rolename= iff(isempty(cloud_RoleName) == true, 'Unknown', cloud_RoleName)
    | where rolename == app
    // analyze call duration
    | extend UserExperience = case(success != true, '1. Faulted', duration <= satisfiedThreshhold, '4. Satisfied', duration <= toleratingThreshhold, '3. Tolerating', '2. Frustrated');
appdexdata
| summarize Requests=count(), Users = dcount(User) by UserExperience, InterestingDimension, bin(timestamp, interval)
| render areachart with (kind=stacked100, series=Requests, Users)
Things to be aware of
- These queries work best for public-facing sites that continuously receive some level of traffic
- In low-traffic situations, for example, late at night, a single fault could skew results
- Measuring performance at the edge of your application is only an approximation of user experience, more factors are at play like network latency, lags and delays in the browser and general UX concepts like feedback to the user when something takes longer than desired.
Further reading
- Apdex users group
- New Relic - How to choose the Apdex T
- Jakob Nielsen - Response times : The 3 important limits