Monitor Container App Scaling
Posted 13 May 2023
Auto-scaling is what Container Apps does so very nicely but insights into what it's actually doing under the hood could be better.
The following query visualizes the scale of your apps over time so you can keep tabs on the automated scaling.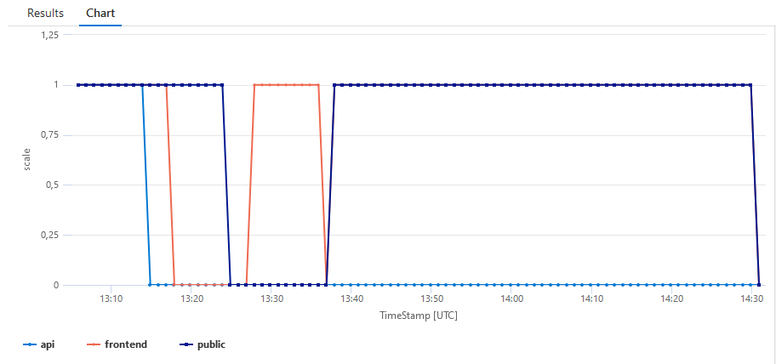
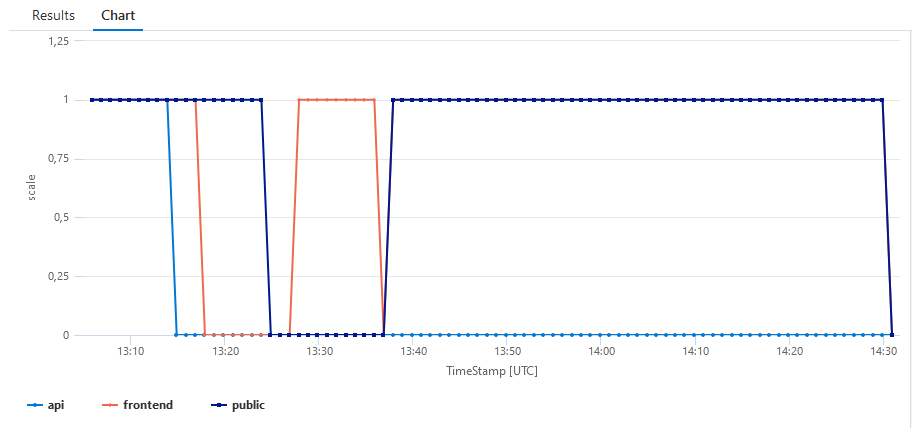
Chart of container scale over time
// Activation/deactivation of an app
let activationEvents = ContainerAppSystemLogs_CL
    | where Reason_s == 'KEDAScaleTargetActivated' or Reason_s == 'KEDAScaleTargetDeactivated'
    | parse kind=regex Log_s with * "(Deactivated|Scaled) apps/v1\\.Deployment k8se-apps/.* from " scale_from: int " to " scale_to: int
    | summarize arg_max(time_t, *) by TimeGenerated, RevisionName_s, ContainerAppName_s, scale_from, scale_to
    | project TimeStamp=time_t, app=ContainerAppName_s, scale_to;
// Changes in scale for an app
let scaleEvents = ContainerAppSystemLogs_CL
    | where Reason_s == 'ScalingReplicaSet'
    | parse kind=regex Log_s with * "Scaled (up|down) replica set " app @"--[a-z0-9\-]+ to " scale_to: int
    | distinct TimeStamp=time_t, app, scale_to;
let all = union activationEvents, scaleEvents;
let min_t = toscalar(all | summarize min(TimeStamp));
let max_t = toscalar(all | summarize max(TimeStamp));
all
| make-series scale=max(scale_to) default=double(null) on TimeStamp from min_t to max_t step 1m by app
| extend scale=series_fill_forward(scale)
| render timechart with (title = "Container App scaling")The range for the query is not set explicitly, even though the Azure portal my say it is. Make sure you select the appropriate time range or adjust the query to set it.
Query execution will fail if there is no scaling data within the specified time range. The error will be similar to this:
Relop semantic error: SEM0031: bin_at(): argument 3 must be a constant valid datetime value